Ask what an incident-automation product does and you will be told what it fixes. The harder engineering problem, and the one that decides whether on-call trusts the thing, is what it does when the correct answer is to fix nothing and wait.
Consumer lag. Queue depth. Replication delay. Batch backlog. Index rebuild. In each case the number is genuinely bad, the service is genuinely healthy, and the right response is to watch it come down. Acting would make things worse. Escalating wastes an engineer. Ignoring it is right about ninety per cent of the time, which is exactly the wrong reason to ignore it.
Why humans are bad at this specific job
Waiting is not hard. Waiting attentively, for twenty-five minutes, at three in the morning, while unable to do anything else is hard, and it is the shape of the work.
What actually happens is one of three things. The engineer watches a dashboard for half an hour and closes the incident with "recovered" — correct outcome, no record, and the same thing happens next week. Or they get distracted, come back forty minutes later, and find it either fixed itself or got much worse. Or they escalate, because escalating is the only action available that feels like progress.
The measurement that surprises teams
Count the incidents in your last quarter that closed with no change made to anything. Most teams have never pulled this number. When they do, it is commonly a fifth to a third of the queue — full incident cost, full escalation cost, and at the end of it somebody wrote "resolved itself".
What a watch step actually has to do
The naive implementation is a loop: check the value, sleep, check again. It fails on four counts, and each one turns out to matter.
for 30 minutes"] N --> P2["Compares first to last,
so one spike decides it"] N --> P3["Dies with the process;
a restart loses the watch"] N --> P4["Says ‘still high’
and nothing more"] P1 --> S1["Park the execution
status=waiting, resume_at set,
context rebuilt on resume"] P2 --> S2["Least squares from the peak
direction, slope, time to threshold"] P3 --> S3["State lives in the database
any worker can pick it up"] P4 --> S4["Every reading recorded
with the trend at that moment"] style S1 fill:#e8f8f4,stroke:#22c1a4 style S2 fill:#e8f8f4,stroke:#22c1a4 style S3 fill:#e8f8f4,stroke:#22c1a4 style S4 fill:#e8f8f4,stroke:#22c1a4
Parking rather than sleeping. The execution is suspended with a resume time and written to the database. No worker is held; a deploy in the middle of a watch does not lose it; the agent rebuilds the context from the steps that already ran and carries on.
Judging the trend from the peak, not the window. This is the part we got wrong first, and it is worth the detail because it is easy to get wrong in the same way.
A bug worth describing
The first version fitted a line across the whole fifteen-minute window. A backlog that jumped to 30,000 and had been draining for two minutes was reported as rising — because the window still contained the jump, and the jump dominates the fit. The agent would then have paged someone about an alert that was already fixing itself. The fix is to measure from the series' high point: what matters is the behaviour since the peak, not the shape of the spike that caused it.
There is a second subtlety underneath that one. A queue sitting at 20,000 and jittering by ±40 has a slope, and reporting that as "falling" promises a recovery that is not happening. So a direction is only named when the movement projected across the window is a real fraction of the level — otherwise it reads as flat, which is the truth.
Three endings, all of them honest
| Outcome | What the agent does | What the record says |
|---|---|---|
| It clears | Resolves the incident. No action taken, and none needed. | "19855 is < 25000 — the condition has cleared on its own after 3 checks. No action was needed." Every reading attached. |
| It stops recovering | Escalates once the checks are used up. | "Watched for 3 minutes over 3 checks and 53188 is still not < 10000; the trend is rising. This needs a person." |
| The source clears it first | Closes the parked execution out. | "The incident was resolved at the source while the agent was waiting; the last reading was 10765 against a threshold of 10000. Nothing further was needed." |
That third row is the one that exposes whether a system is honest, and it was a real bug before it was a feature. Alertmanager resolved the alert while the agent was parked; the agent's claim logic excludes closed incidents, so the execution would never be picked up again. It sat in waiting for ever, on an incident that had already ended, with nothing on the record to explain it. Now the sweep closes those out and says why.
What the on-call actually sees
While a watch is running the incident carries an amber banner: waiting and watching. Nothing is wrong and nobody needs to act yet; the agent looks again in about four minutes. The step below it shows the readings so far, the direction, the threshold and the estimated time to clear.
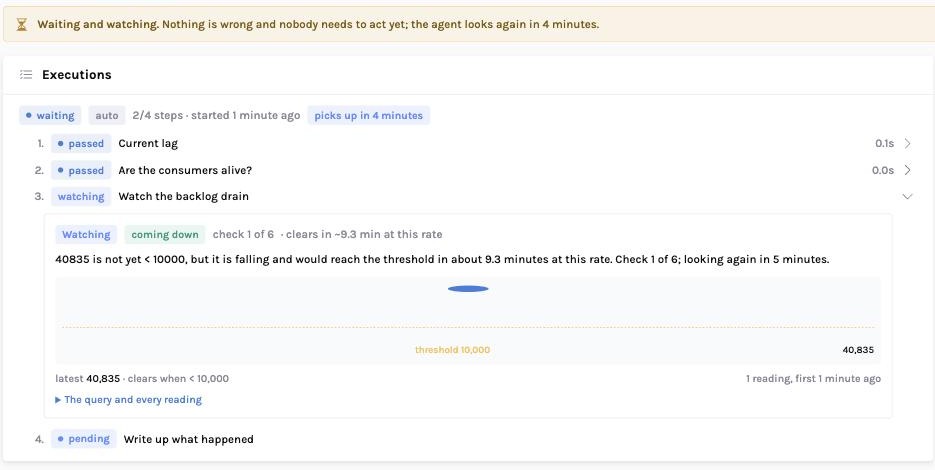
The deliberate choice there is that the banner is short. The full reasoning is on the step; the banner exists to tell someone at 3am that they can put the laptop down. Repeating the same sentence twice within one screen reads as a bug rather than as emphasis — which we know because the first version did exactly that.
Where a watch is the wrong tool
If the value has never recovered on its own, do not watch it — that is a capacity problem wearing a monitoring costume, and watching it just delays the page by twenty minutes. The Patterns page is the check: an alert that fires repeatedly and always ends up escalating after a watch is telling you the threshold is wrong or the cause is unaddressed.
Next in this series
Approvals and blast radius — what an agent may do on its own, what it must ask about, and how to set that boundary so it belongs to your change policy rather than to a vendor default.