The short version
- MTTR alone will mislead you. It moves for reasons that have nothing to do with the programme, and it can improve while things get worse.
- Four numbers, read together: MTTR, runbook coverage, escalation rate, and the share of incidents that needed no action at all.
- The fourth is the one almost nobody tracks, and it is usually the largest single finding — for most teams it is a fifth to a third of the queue.
- Every one of these is a query over incidents you already have. No new instrumentation, and nothing a vendor has to supply.
Six months in, someone will ask whether this was worth it. The honest answer depends on having measured the right things from the start — and the metric everyone reaches for first is the one most likely to produce a misleading answer.
Why MTTR on its own will mislead you
Mean time to resolve is the standard number and it has three failure modes, all of which we have seen produce the wrong conclusion.
| Failure mode | What happens |
|---|---|
| The mean hides the shape | Forty incidents at four minutes and two at six hours average out to something that describes neither. The long tail is the business impact and the mean buries it. |
| It improves when things get worse | Add a noisy alert that self-resolves in thirty seconds and your MTTR drops beautifully. You have made on-call worse and the metric says otherwise. |
| It moves for unrelated reasons | A quiet quarter, one fewer legacy service, a new starter who escalates less. None of it is your programme, and all of it shows up in the number. |
Track it — as a median alongside a p90, not a mean — but never alone.
The four numbers
median and p90"] --> R["Read together"] C["2 · Runbook coverage
% of incidents a runbook matched"] --> R E["3 · Escalation rate
% reaching L2 with no change at L1"] --> R N["4 · No-action rate
% closed with nothing changed"] --> R R --> I(["Any one of them
can be gamed.
Together they cannot."]) style N fill:#fff4e2,stroke:#f4a03a,stroke-width:2px style I fill:#e8f8f4,stroke:#22c1a4,stroke-width:2px
Runbook coverage is the leading indicator. It tells you how much of your alert volume the system can even attempt, and its complement — the alerts nothing matched — is a prioritised list of the next runbooks to write. Coverage rising while MTTR is flat is not failure; it is the month before MTTR moves.
Escalation rate is the one that most directly measures the thing this is for. Specifically: incidents that reached L2 with no change made at L1. Every one of those is an escalation the information gap caused, and it is the number that should fall first.
No-action rate is the one almost nobody tracks, and the most interesting.
The fourth number, and why it is the one to start with
What share of your incidents close with no change made to anything? Not "resolved quickly" — nothing was done. The alert fired, someone looked, the condition passed, they closed it.
For most teams it is between a fifth and a third of the queue. Full incident cost, often full escalation cost, frequently out of hours — for alerts where the correct action was to wait.
It measures three different things at once
A high no-action rate means some combination of: your thresholds are too tight, your alerts fire on conditions that self-heal, and your tooling does not distinguish "wait" from "act". All three are fixable and none of them is visible in MTTR — in fact they improve MTTR, which is exactly why the two must be read together.
It is also the number most directly moved by watch-and-wait. Before, each of those incidents consumed an engineer for twenty minutes. After, they close themselves with the readings attached. The incident count does not change; the human cost does — which is invisible unless you are tracking this specifically.
Reading them together
| What you see | What it probably means |
|---|---|
| Coverage up, escalation down, MTTR flat | Working. MTTR lags — the incidents being handled were the cheap ones. Give it a quarter. |
| MTTR down, no-action rate up | Suspicious. You may have added noisy alerts that self-resolve. Check whether the alert mix changed. |
| Coverage up, escalation flat | Runbooks are matching but not answering. They gather and hand over without settling anything — look at what the verification is capping. |
| Everything flat | Either coverage is too low to matter yet, or the runbooks cover alerts that were never the problem. Check alerts no runbook matched. |
| No-action rate falling | The best single signal. Either the benign alerts are being handled without a person, or you have tuned them away. Both are wins. |
Two more worth watching, less often
Runbook effectiveness — resolved divided by matched, per runbook. A runbook that matches often and resolves rarely is gathering evidence and handing over, which may be exactly right for something like latency, or may mean it is missing the step that would settle it. The number does not tell you which; it tells you which runbook to look at.
Agreement rate split by confidence — when the agent is confident, is it right? When it is uncertain, was it right to be? This is the trust metric, and it is the one to check after any change to a reasoning step. A drop in agreement at high confidence is the single most important regression this system can have.
The metric we deliberately do not provide
Hours saved. It requires assuming what would have happened otherwise, which is unfalsifiable, and everyone in the room knows it. Including it in a report undermines the four numbers that are real. If someone insists, give them the escalation-rate delta multiplied by your own measured handoff time — and say out loud that it is an estimate built on your numbers rather than a measurement.
Where these come from
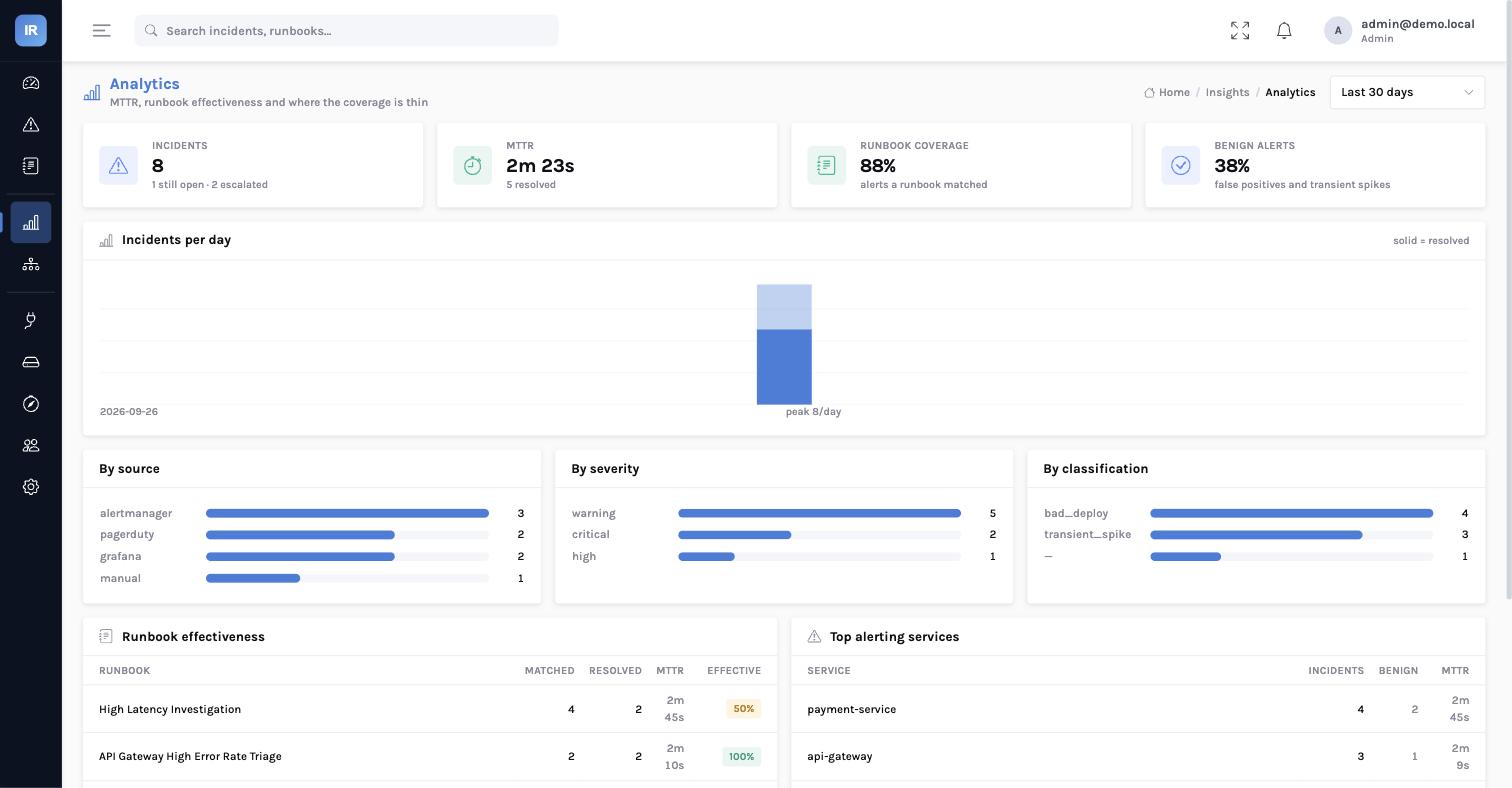
All of them are queries over the incidents themselves, which is a deliberate property: the numbers cannot drift from the records behind them, and anyone can check one by opening the incidents it counted. The Analytics page shows MTTR, coverage, the benign share and per-runbook effectiveness for a window; Patterns groups recurring alerts with a suggested action and the rule that produced it.
That is the series
Twenty-seven posts, from how incident response actually works today through to measuring whether you changed it. If you want to start rather than read, the docs have the compose file, and the ninety-day sequence is the shortest path from there to something you can judge.