- contact@insightairesolve.com

Webhooks from PagerDuty, Alertmanager and Grafana become one incident. An AI agent follows your runbook, gathers the evidence, classifies the cause, and resolves or escalates with context.
For on-call engineers who arrive at 3 a.m. to an incident that has already been triaged — and for SRE teams that want runbooks to be steps, rules and variables they edit, version and dry-run, not a wiki page that goes stale.


Built for the tools your on-call already lives in
During an incident the on-call engineer context-switches across PagerDuty, Grafana, Prometheus, Alertmanager, Airflow, dbt, the database, Jira, Slack and a runbook wiki. The runbook is stale, the tribal knowledge is in someone’s head, and MTTR is whatever it takes to find them.
Alert details in one place, the metric in another, the deploy history in a third. The first fifteen minutes of every page are spent gathering, not deciding.
Runbooks written after the last incident describe last year’s system. Nobody knows which steps still apply, so nobody follows them.
New on-call engineers drown; the senior ones get woken up anyway. The fix and the reason for it never get written down where the next person will look.
One loop, every alert. The agent does the L1 work; your engineers arrive with the evidence gathered and the first diagnosis done.
Webhooks from PagerDuty, Alertmanager, Grafana or any custom source are normalized into one incident model and deduplicated by fingerprint.
Match rules on alert name, service, severity, labels and source pick the runbook. No rule? The agent enters AI triage and proposes one.
InsightWorker runs the steps: PromQL, dashboards, SQL, DAG status, pod logs — each output saved as evidence, each step streamed live.
The agent classifies the root cause with a confidence, writes the RCA, and resolves the page or escalates with everything it found attached.
Every execution scores the runbook’s effectiveness, surfaces recurring patterns, and suggests silences, threshold tuning or a new runbook.
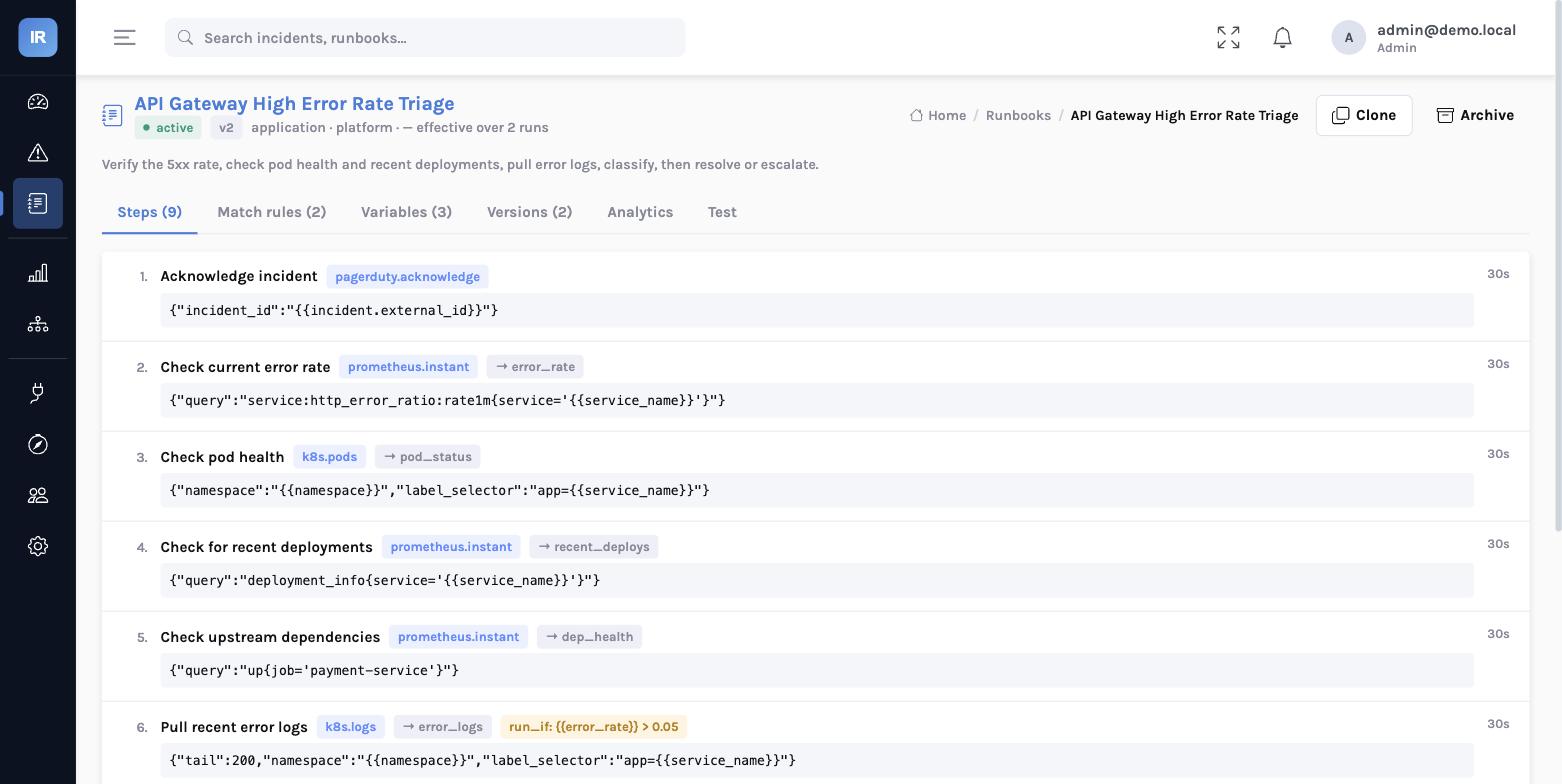
Every step is an action with typed parameters. Outputs become variables the next step can use. Conditions decide what runs.
# variables
service_name = {{incident.labels.service}}
threshold    = {{incident.labels.threshold}}   # default 5.0

# steps
2. prometheus.instant  query: rate(http_requests_total{service='{{service_name}}',code=~'5..'}[5m])
                       save_as: error_rate
4. postgres.query      sql: SELECT version, deployed_at FROM deployments WHERE service='{{service_name}}' ...
                       save_as: recent_deploys
6. k8s.logs            run_if: {{error_rate}} > {{threshold}}
                       save_as: error_logs
7. ai.classify         categories: [bad_deploy, upstream_dependency_failure, capacity, false_positive]
                       context_vars: [error_rate, pod_status, recent_deploys, error_logs]
9. gate                {{classification.confidence}} > 0.85 AND category == 'false_positive'
                       true:  pagerduty.resolve   false: pagerduty.add_note + escalate
Not a JSON blob and not a wiki page. Steps, conditions, variables and match rules are first-class rows, so two people can edit different steps at once, every save is a version, and every past execution shows exactly what it followed.
Prometheus instant and range queries, Grafana panels, Alertmanager silences, Kubernetes pods, logs and events, Airflow DAGs, dbt tests, SQL, Jira, Slack, HTTP, shell.
Glob on alert name and service, severity sets, label containment, source, expressions. Higher score wins; ties go to priority, then effectiveness. Test any rule against a past incident before you activate it.
{{incident.labels.namespace}} resolved at run timeSnapshots with an auto-generated diff (“added step 5, changed threshold in step 3”), side-by-side comparison, one-click restore. Start from a library template, clone, import from your markdown, or describe the alert and let the agent draft it.
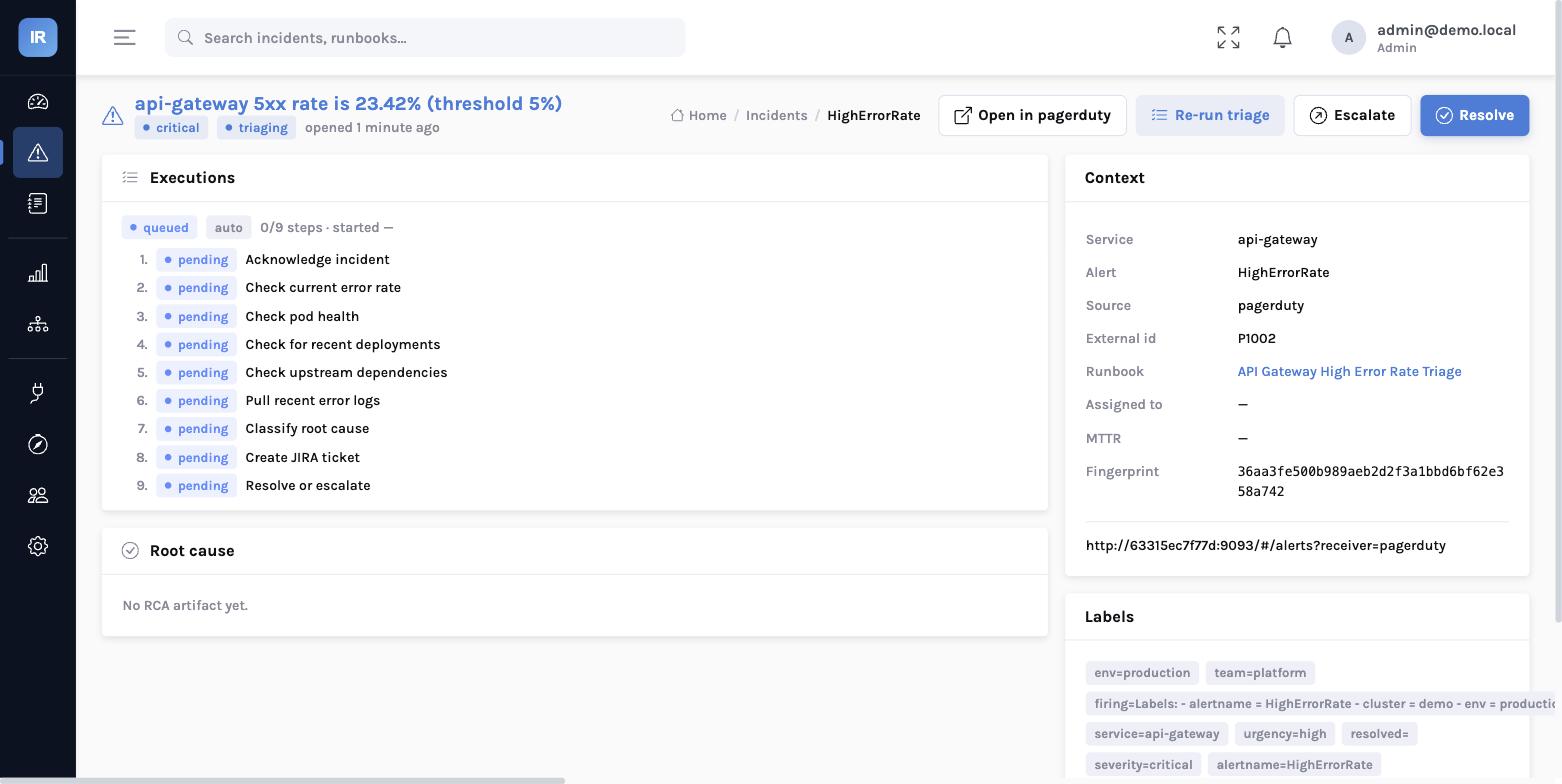
Every incident with its source, severity, labels, the runbook that matched, each step as it runs, and the root-cause artifact when it’s done. Ask the agent a follow-up question from the same page.
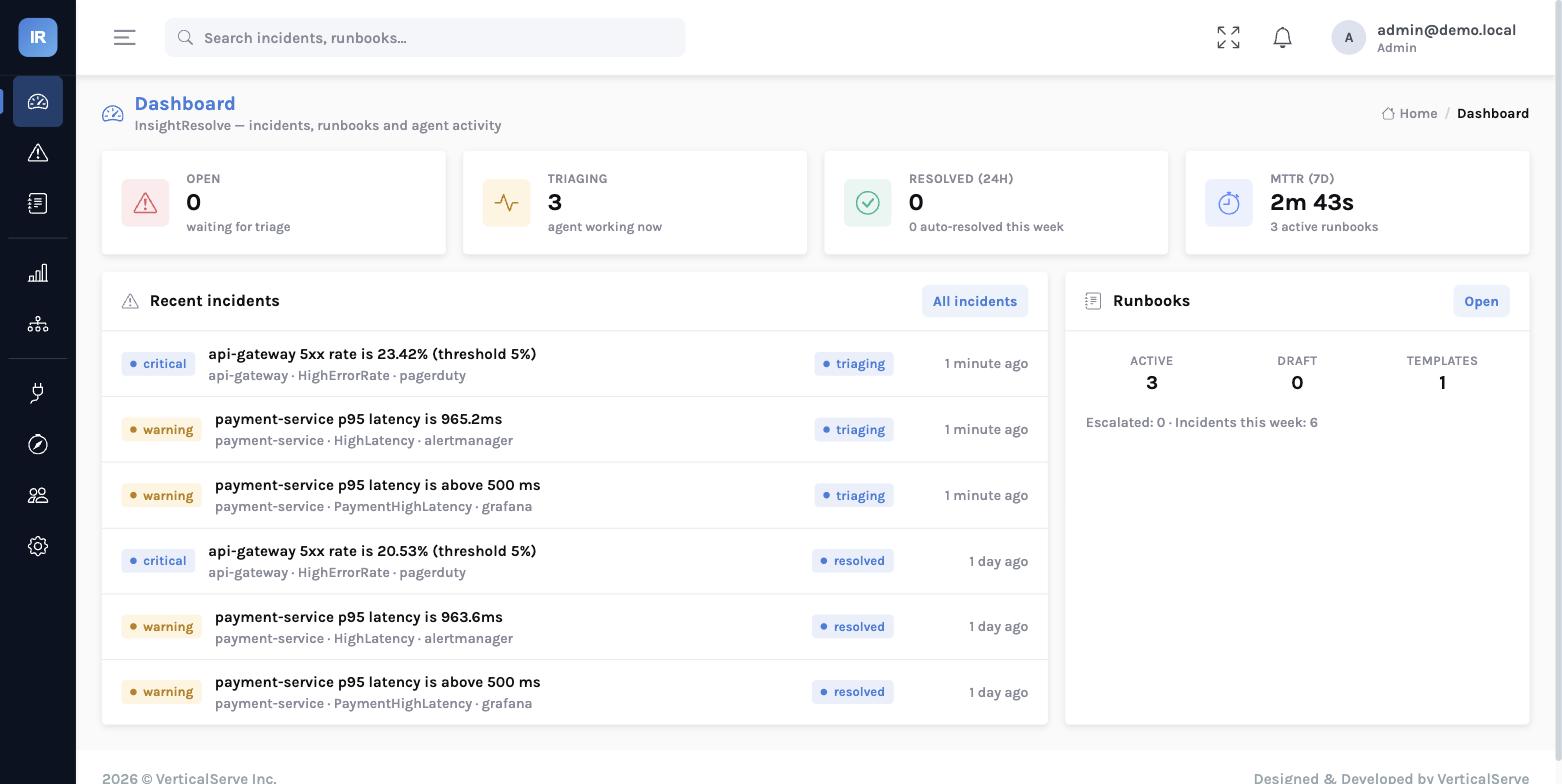
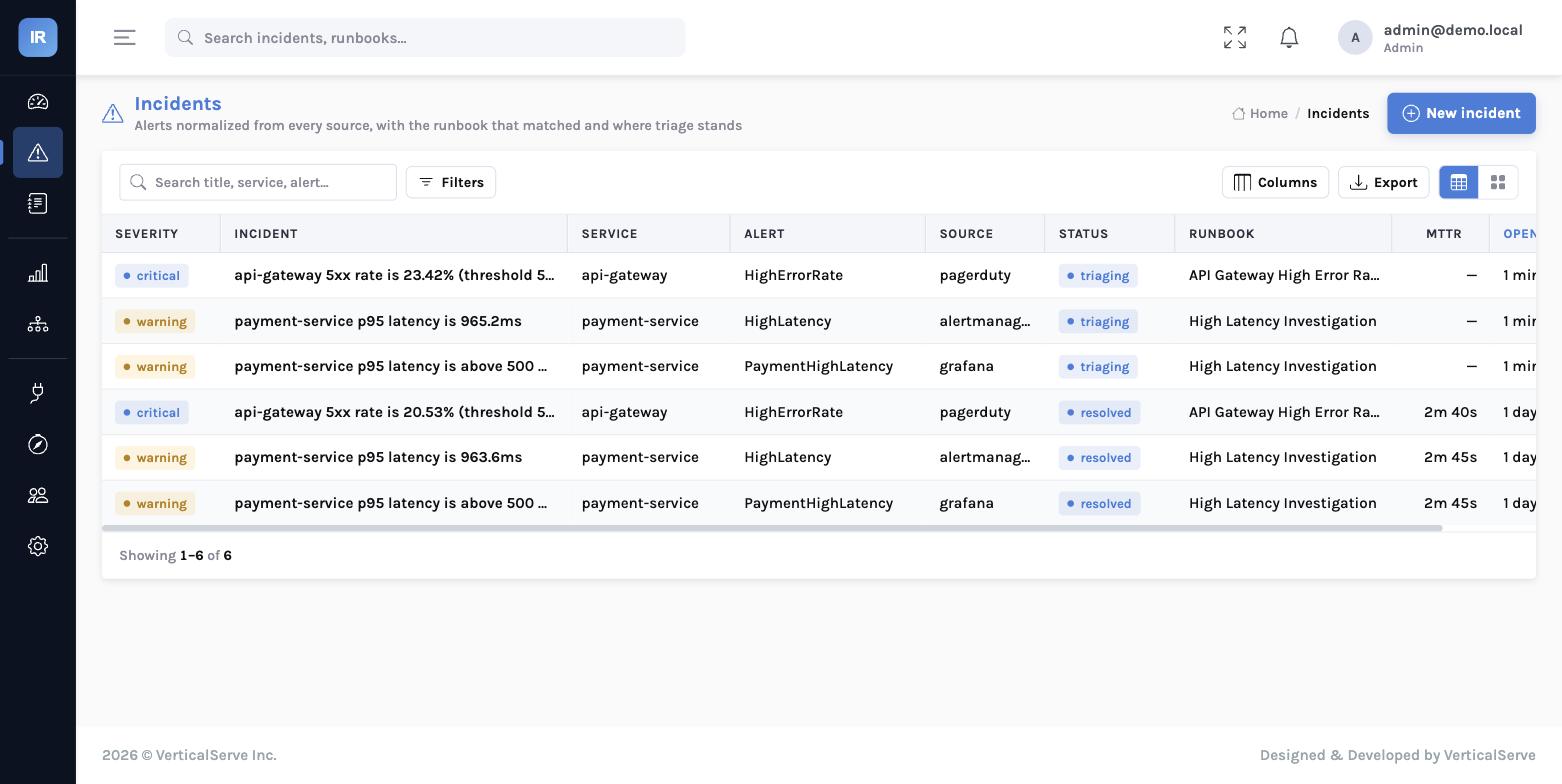
Current step highlighted, outputs streaming in, skip / pause / escalate-now overrides.
Alert fired, webhook received, runbook matched, each step, classification, resolution.
“What’s the CPU on the api-gateway pods right now?” — answered with the same tools.
Classification, confidence, evidence, recommendations, markdown — to Jira or a GitHub PR.
Inbound webhooks and outbound actions through typed connectors. Credentials stay sealed in the connection registry and are handed to the agent only at execution time — secret names, never values, appear in logs.
Outcomes depend on how much of your alert volume has a runbook. We’ll measure your coverage gap on the discovery call and size the MTTR gain from it.
From page to first diagnosis, versus 15–30 minutes by hand
Pages for confirmed false positives — resolved with a note
Incidents with an RCA artifact and the evidence behind it
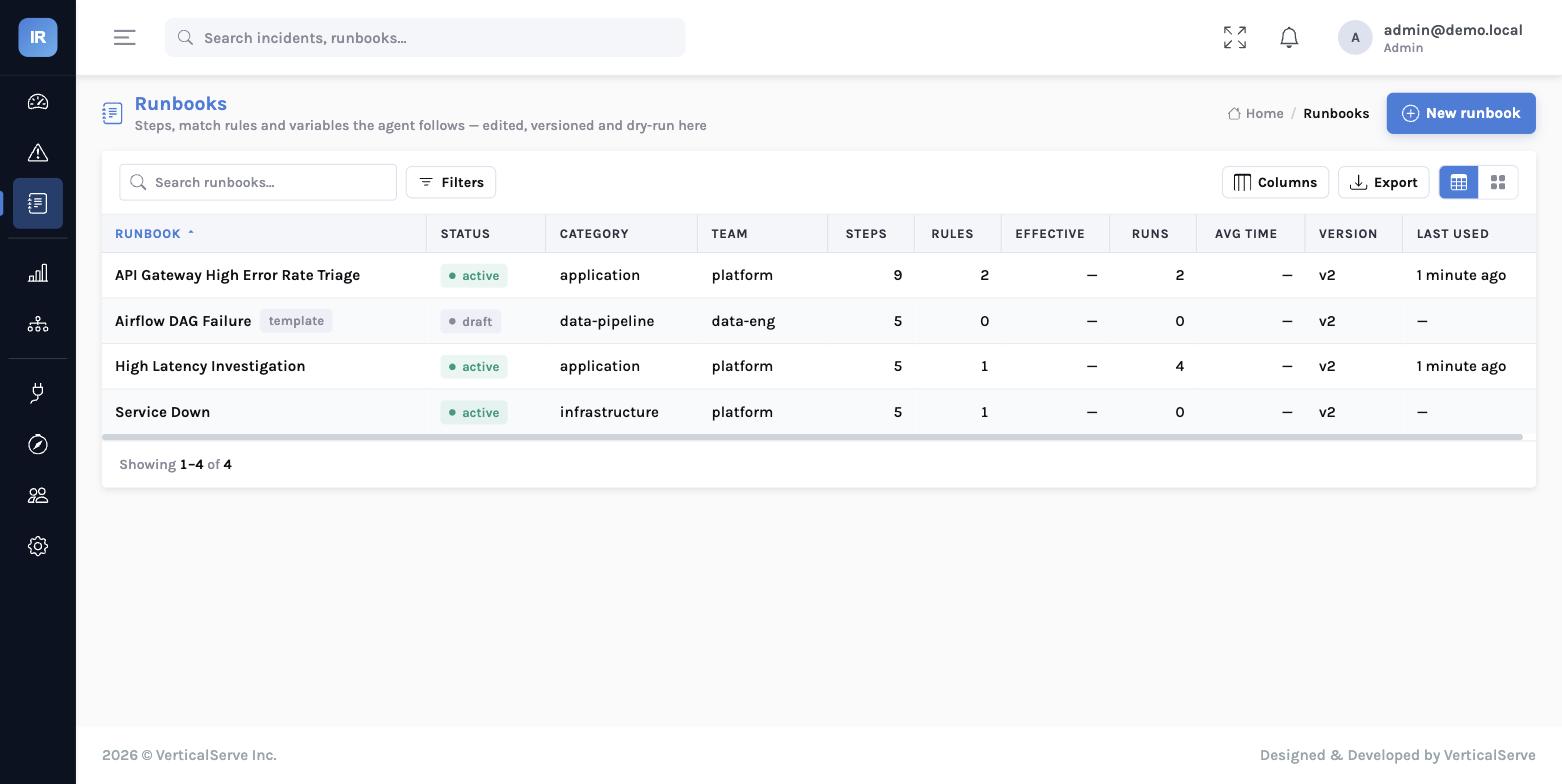
Place runbooks live, versioned, scored and kept current
InsightResolve does not invent a new agent. It uses InsightWorker — the same engine behind InsightTestBench and InsightStudio — with operations skills added. Same identity, same connection registry, same audit trail as the rest of the Insight suite.
Each runbook step is a skill the agent runs with your credentials for that connection. Reasoning is captured per step; nothing happens that isn’t in the log.
Okta, Entra or any OIDC provider; roles for who edits runbooks and who acts on incidents; API keys for automation; every change and decision in the audit trail.
AWS, Azure, GCP, OCI or on-prem with Docker Compose or Kubernetes. Postgres for state, SSE for live updates, your model provider — Bedrock, Azure OpenAI, Vertex or an OpenAI-compatible endpoint.
Not by default. Phase one is classification, not remediation: the agent gathers, decides and writes. Remediation steps (restart a pod, scale a deployment) exist behind explicit human approval gates you add to a runbook.
The agent enters AI triage: it inspects the alert context, runs general diagnostics, classifies what it can, and suggests a runbook from what it learned — which you review and activate.
In the connection registry, encrypted, or in your cloud’s secret store by reference. They are passed to the worker at dispatch time and never persisted by it; logs and events show secret names, not values.
No. Alerts are fingerprinted on source, name, service and key labels; repeats inside the window fold into the open incident, and a resolved event from the source closes it and records MTTR.
Paste or upload them. The agent parses markdown into structured steps with action types for you to correct and activate. Templates cover the common alerts on day one.
Self-hosted in your environment, with your model provider. Incidents, evidence, RCAs and runbooks stay inside your perimeter.